Age Grading
Age Grading
Age grade tables are used to score a race result as a percentage based on distance, time, age and gender which can then easily be compared with any other age-graded result to give an indication of the better performance.
Related: Age grade calculator.
Age grade tables are compiled and published by World Masters Athletics (WMA), the world governing body for masters track and field, long distance running and racewalking (formerly WAVA - The World Association of Veteran Athletes). The tables were first introduced in 1989 and there have been several revisions since, the latest being in 2015.
The tables contain a set of values, called age factors, which get be applied to a time in order to normalise it based on the runner’s age. They are published for common race distances between 5 and 200 km for ages between 5 and 100. There are different tables for road and track racing.
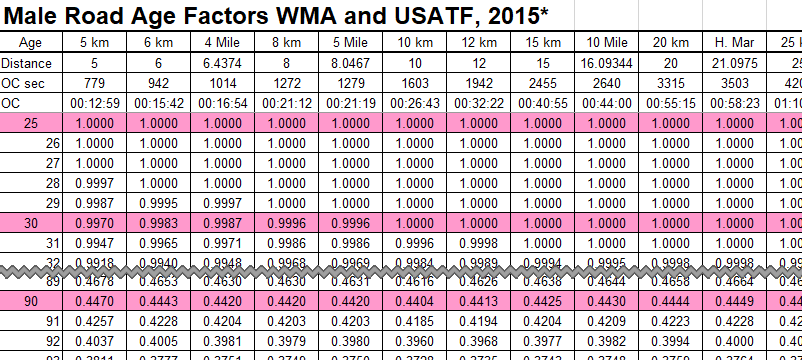
The extract above shows a sample from the male age grade table and shows the factors applied to times from different distances for different ages.
How to use the tables
Let’s work through an example...
Alice's age graded 10k results
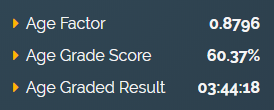
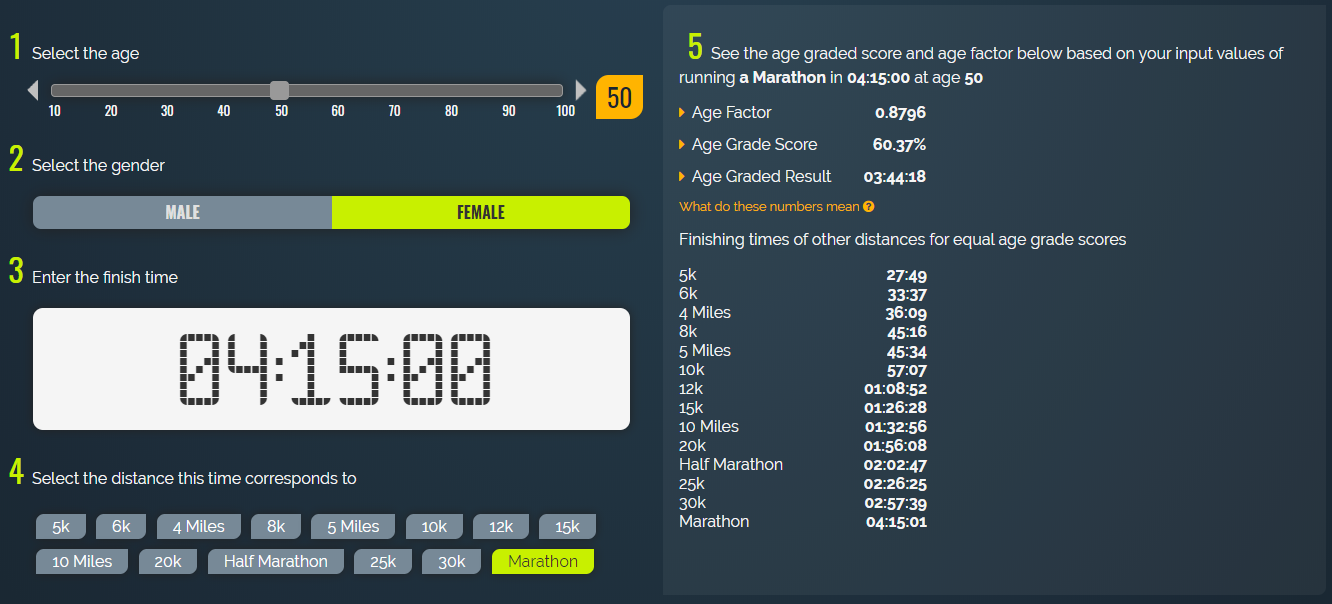
Alice is a 50-year-old female runner who just finished a marathon in 4:15:00. We can use the age grade tables to lookup her age factor and find the value 0.8796 – That is saying she is expected to be able to run 87.96% as fast as her equivalent in the open class (ages 20 and 30 for female marathon runners), purely based on the fact that we slow down as we age.
With this value, we can calculate the age graded result which gives us the equivalent time of someone in the open class. This is calculated by multiplying the actual finish time of 4:15:00 by the age factor of 0.8796 to give an age graded time of 3:44:18 – Over half an hour faster than her real time!
Note: It’s much easier to convert the time to total seconds before applying age factors. 87.96% of 15300 seconds is a simpler calculation that 87.96% of 4 hours and 15 minutes!
Then, with the addition of a ‘base’ value for this distance, we can also calculate the age graded score to compare even further. This base value is the world record time (at the time of publication of the tables) which represents the fastest that is possible over that distance.
To work out the score, take your age graded result as above and calculate this as a percentage of the world record time. In our example, the world record is listed as 2:15:25 (or 8125 seconds) and our age graded result is 3:44:18 (or 13458 seconds) which gives an age grade score of 60.37%.
This age graded score can be used to compare this result against other results from runners of all ages. And because it factors in the world records separately for men and women, their results can also be compared against each other.
But... A word of warning
Not everyone agrees with age grading, some believe it to be a great development and leveller, others think it's a load of hogwash. It's up to you how you use the results and how much emphasis you put on them but don't be surprised to bump into someone how doesn't care for adusted times or scores.
Some results systems include the age graded score or time, so you don’t have to calculate it yourself, but they are free to use any factors or calculations they choose to provide this number. An example of this is Parkrun who use their own tables, based on the WMA versions, so the values in their results will likely vary a little from those calculated by these tables.
Example comparison
Here we can compare Alice against a couple of others from a different race
| Runner | Time | Age Factor | Age Graded Result | Age Grade Score |
|---|---|---|---|---|
| 25-year-old man (Liam) | 45 mins | 1.0000 | 45:00 | 59.37% |
| 50-year-old man (John) | 50 mins | 0.8893 | 44:28 | 60.08% |
| 50-year-old woman (Alice) | 55 mins | 0.8850 | 48:41 | 62.32% |
In the official results, the overall place for the three runners would be Liam>John>Alice based on their finishing times.
When we apply the age factor to their times then we see John and Alice's time come down a little due to their age factors of 0.8893 and 0.8850 respectively and the runners are ordered John>Liam>Alice based on their age grade result.
But that doesn’t consider gender. Once we go a step further and calculate the age grade score, Alice, despite being 5 minutes slower than John and 10 minutes slower than Liam, is scored higher. This is because her time is closer to the estimated best a 50-year-old woman could expect to run than either of Liam or John's is to their respective target records. The order based on this method is Alice>John>Liam based on their age grade score.
Alice can also compare her marathon age grade score of 60.37% and her 10k score of 62.32% to see that her 10k time would be considered the better of the two.
Although these calculations even out several variables, as when comparing times across multiple races, they don’t consider external factors such as different weather conditions and different elevation or terrain.
Seeing the calculations in action
This test has been done by calculating the age graded results from the non-elite runners in the London Marathon 2019. The runner in first place for each age category was selected and the age grading was applied to their time.
As age categories are given in 5-year ranges, the lowest value is used for age grade calculations (e.g. for the 45-49 age group, an age of 45 is used).
| Open | 40-44 | 45-49 | 50-54 | 55-59 | 60-64 | 65-69 | 70-74 | 75-79 | 80-84 | ||
|---|---|---|---|---|---|---|---|---|---|---|---|
| M | Age Factor | 1.0000 | 0.9725 | 0.9350 | 0.8961 | 0.8572 | 0.8183 | 0.7794 | 0.7405 | 0.6929 | 0.6277 |
| Age Grade Score | 89.52 | 88.33 | 90.17 | 87.83 | 89.28 | 85.47 | 89.09 | 86.84 | 84.56 | 65.59 | |
| Age Grade Time | 02:17:21 | 02:19:12 | 02:16:21 | 02:19:49 | 02:17:43 | 02:23:51 | 02:18:00 | 02:21:35 | 02:25:24 | 03:07:28 | |
| F | Age Factor | 1.0000 | 0.9699 | 0.9318 | 0.8796 | 0.8246 | 0.7696 | 0.7146 | 0.6596 | 0.6042 | 0.5352 |
| Age Grade Score | 89.36 | 86.92 | 88.67 | 87.94 | 93.01 | 89.26 | 92.8 | 84.13 | 92.79 | 88.35 | |
| Age Grade Time | 02:31:32 | 02:35:48 | 02:32:43 | 02:33:59 | 02:25:36 | 02:31:43 | 02:25:55 | 02:40:51 | 02:25:57 | 02:33:17 |
This shows a pretty consistent performance, especially in the lower age categories where there are plenty of runners. It starts to become a little more variable at the other end of the scale, but this is data from a single runner in each category from a single race (where some categories only have a few runners), but enough to give some validity to the factors provided.
Try it
The easiest way to start calculating age grading scores is to use our age grade calculator!
...Or you could work it out yourself if you really feel the need to.
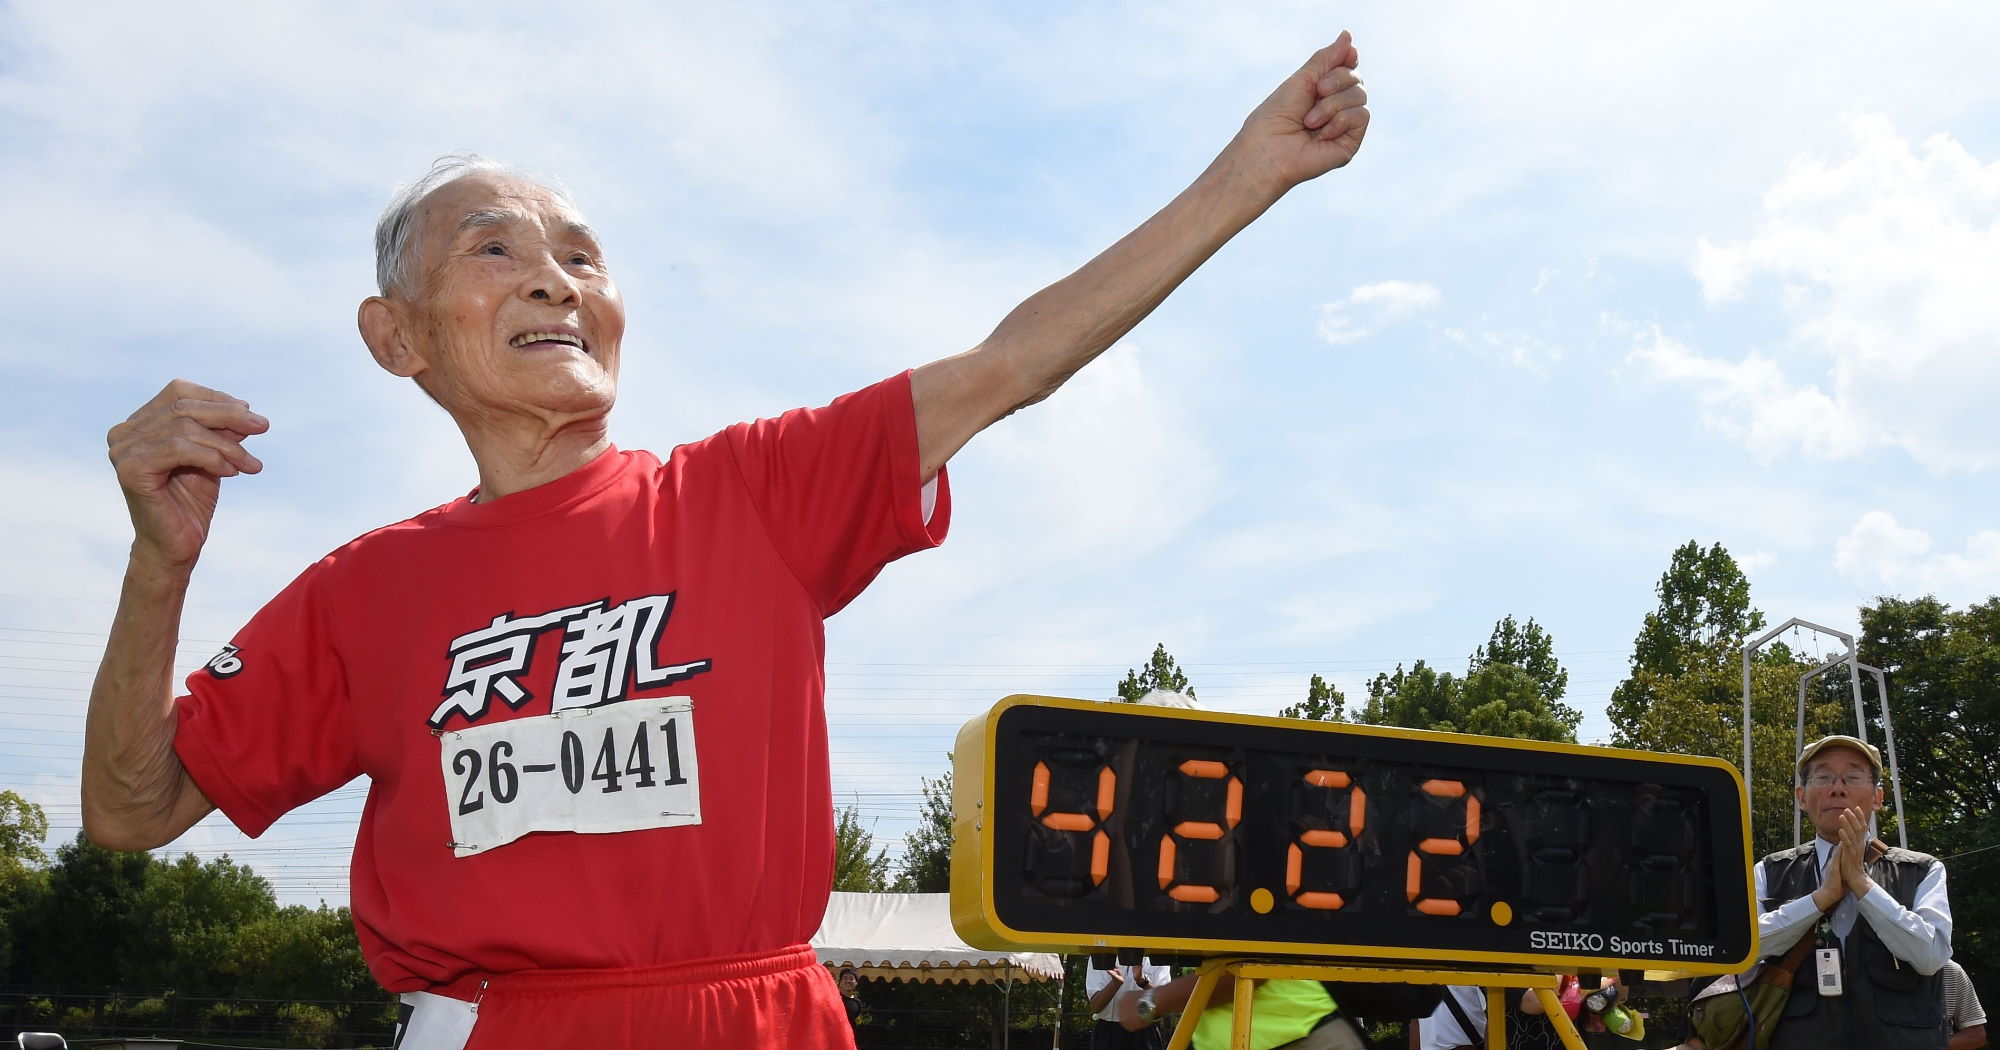
Oh, and the guy in the image for this article? That is Hidekichi Miyazaki after he ran 100 metres in 42.22 seconds at 105 years old, an age adjusted time of 10.2 seconds with a score of 95.94%!
And what's even more amazing is that isn't even the world record in the M105 category! That belong to Stanisław Kowalski with a time of 34.5 seconds!